
![]()

◆Cryptocurrency market conditions <strong>
The number of rising stocks is increasing as the buying trend flows into the sluggish cryptocurrency market. As of 14:00 on the 2nd, Binance BTCUSDT, a cryptocurrency exchange, has been rising by 2.25% since its opening, while ETHUSDT on the same exchange has risen 2.24% and DOTUSDT has risen to 0.02%. Ripple (XRP), which surged on the weekend and turned to a sharp decline the previous day, is still weak at -0.87%.
Last night, the US New York Stock Market closed higher on expectations of Google and Amazon’s earnings announcements scheduled for today. The two companies increased 3.6% and 4.3%, respectively, driving the NASDAQ index. On the 25th (local time) on the New York Stock Exchange (NYSE), the Dow Jones 30 industrial average index rose 0.76% from the previous length to 30,211.91, the Standard & Poor’s 500 index rose 1.61% to 3,774, and the technology stock-oriented Nasdaq index 2.50%. The deal closed at 13,249, which rose.
As of 14:00 on the 2nd, the price of bitcoin based on CoinMarket Cap is $31,745.60, the 24-hour trading volume is about $68 billion, and the market cap is about $697.5 billion. The total cryptocurrency market cap is $1,122.9 trillion, and the market cap share of Bitcoin is 62.1%.
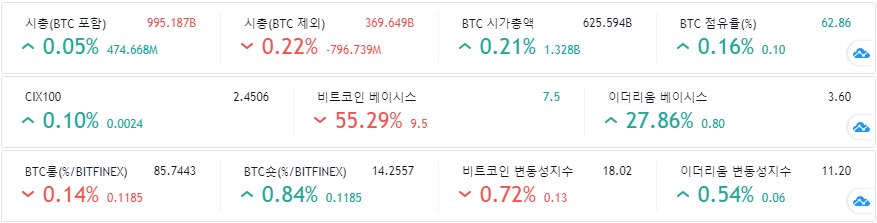
The total cryptocurrency market cap increased by 0.05% compared to the previous day, and the market cap excluding bitcoin decreased by 0.22% compared to the previous day, making Bitcoin stronger than Altcoin, and the market cap of Bitcoin increased 0.21% compared to the previous day. The market share of the company increased by 0.16% compared to the previous day, indicating that the market as a whole has fewer coins than the bitcoin price.
On the other hand, according to the Weiss Crypto Index, the market, which showed strength for about 30 minutes immediately after opening, turned to weakness around 10 o’clock. However, it was analyzed that the buying trend for mid-sized stocks was rather weak. W50, a cryptocurrency market index including bitcoin, +0.11%, W50X, a cryptocurrency market index excluding bitcoin, -0.48%, WLC, a large stock-oriented index, +0.15%, and WMC, a medium-sized stock-oriented index. -0.61% WSC, an index focused on small stocks, recorded +0.31%.


As of 14:00 on the 2nd, the ratio of buy:sell cumulative transaction volume in the last 24 hours at major cryptocurrency exchanges was 52%:48%, and the buy ratio was high, and as of 14:00, the buy ratio was also high in the long/short ratio of each exchange.
At the same time, on the cryptocurrency derivatives exchange BitMEX, the basis of Bitcoin futures was around 7.5, and the basis of Contango and Ethereum futures was around 1.60. The price of Bitcoin futures on the Chicago Merchandise Exchange (CME) is rising. February futures traded at $33,885.0, up $35.0 (+0.10%) from the previous day.
◆Main cryptocurrency prices <strong>
As of 14:00 on the 2nd, the domestic bitcoin (BTC) price increased by 0.36% from the previous day to 3,6752,000 won, Ethereum (ETH) decreased by 0.03% to 1492,000 won, and Polkadot (DOT) fell 2.01% to 17,520 won. Recorded. Ripple (XRP) rose 2.98% to 415 won, Bitcoin Cash (BCH) fell 0.48% to 449,300 won, ADA fell 3.34% to 434 won, Stellar Lumen (XLM) rose 057% to 354 won, Chain LINK is trading at 24,990 won, up 0.24% from the previous day, and Litecoin (LTC) is trading at 146,500 won, up 1.74%.


At the same time, the global cryptocurrency market price based on CoinMarket Cap is on the rise among the top 10 stocks by market cap as of the last 24 hours. The international Bitcoin (BTC) price is $33,959.83, up 1.01% from the same time the day before. Ethereum (ETH) rose 4.37% to $1,372.88, while Ripple (XRP) fell 29.64% to $0.3777. Polkadot (DOT) rose 0.80% to $16.17, Cardano (ADA) rose 15.23% to $0.3978, Chainlink (LINK) rose 2.83% to $23.06, Litecoin (LTC) rose 3.98% to $135.18, Binance Coin (BNB) rose 3.64% to $50.60, and Bitcoin Cash (BCH) rose 3.64% to $413.79.
◆ Analysis of major media and market experts <neutral>
Market experts say that bitcoin prices remain mixed after a short-term high and decline, trapped between $34,000 to $35,000 at the top and $32,000 at the bottom, with no clear direction and still showing no clear signs that the sell-off has ended. Analyzed. In addition, it is explained that the relatively low trading volume compared to the recent strong bullish period means that such a mixed trend is likely to continue for the time being.
(Positive opinion)
① Tom Lee, founder and chief analyst at Fundstrat Global Advisors, a US investment research firm, had a positive outlook that “in the future, $6 trillion worth of private investor funds will flow into bitcoin and stocks.”
② Mark Cuban, a famous US investor, said, “Blockchain-based assets are a legitimate means of storing value.” “The digital value store is not limited to cryptocurrency,” he said. “It includes tokens created to support Defi (decentralized finance), etc.” He added, “All of these are value storage means with a long history with Bitcoin, the market capitalization leader.”
(Neutral opinion)
① Cryptocurrency analyst Rakesh Upadhyay said, “Bitcoin is bottoming out near the 20th moving average line ($33,412), and the relative strength index (RSI) is also close to the middle level and balances supply and demand. “If we push the sell-off bitcoin price below the $31,900 support level, we could retreat to the 50-day moving average (around $30,920) and even the core support level of $28,850, but the buy tax would hit more than $35,000. If maintained, there is a possibility that the price will rise to more than $38,520 and even more than $40,000.”
② Cryptocurrency analyst Aayush Jindal said, “BTC/USD pair price is above the 33,000 dollar and 33,200 dollar resistance levels, but in order to keep rising, we need to resolve the resistance of 34,000 dollars. If we successfully cross the $34,000 resistance line, If it crosses over to the US$35,400 and even the US$36,200 resistance area, he said, “If bitcoin fails to resolve the $34,000 hurdle, it will turn downward and the price can retreat to the $33,000 and $32,200 support lines, and even Even the $30,000 support line could be threatened.”
③ Coinnis special analyst’JIn’s Crypto’ said, “Based on the BTC/USDT 4-hour candle chart, the main moving average line is entangled between $32,771 and $34,246. If BTC rebounds strongly and the line is valid at $34,246 If the breakthrough is successful, it can be seen as a rising signal.” “Conversely, if the $32,771 line collapses, it can be seen as a short-term bearish signal. Although BTC is holding the $23,908 line, which corresponds to a 23.6% Fibonacci retracement rate, on a 4-hour basis, it is a clear signal that the short-term decline has ended. Is not appearing.” “The relatively low trading volume means that the mixed tax will likely continue for some time in the future,” he explained.
(Negative opinion)
① Michael O’Rook, chief market strategist at JonesTrading, said, “If the bitcoin price continues to fall below the 50-day moving average, we confirm that the last four months’ movement was a speculative blow-off top. “You have to play a role.”
② JP Morgan strategists pointed out that “it is difficult to recover $40,000 in bitcoin due to the current inflow of institutions,” and pointed out that “the short-term risk balance is still on a downward trend.”
③Neel Kashkari, president of the Federal Reserve Bank of Minneapolis (FRB) attended an online seminar on the 1st (local time) and said, “Bitcoin is a toy for speculation.” He compares Bitcoin to the stuffed animal Beanie Babies, saying, “The past beanie babys speculation craze has now shifted to Bitcoin. Whether investors lose or earn money from it, it’s up to them. I don’t need to change my thinking about monetary policy because of speculators.”
◆Comprehensive Analysis of Bitcoin Market Price <Strengthening>
Bitcoin daily market price (see Figure 6), which showed large price fluctuations over the weekend, has been repeatedly pushed over and over as the 20-day moving average line acts as a resistance line based on the closing price for the past three days. Technically, it is at Fibonacci’s second retracement point from the low, and it seems obvious that the direction in the current section of the 20-day moving average will determine the direction of the short-term market price. First, if it breaks above $34,778, which is the top of the box section, the Bitcoin price is expected to rise to $36,945, the top of the trend line and Fibonacci’s fourth retracement level. However, if it is pushed below the moving average line on the 20th and enters the cloud zone of the Ichimoku balance table, it will enter a downtrend, and the future market price will be weakened, so it is necessary to respond with reference.

Meanwhile, today is the February 2 settlement date for Bitcoin and Ethereum options on the DRBT exchange. Options that are due today are expected to have little impact on the market as the strike price is low and the number of outstanding contracts is relatively small compared to other maturity dates. As a result of analyzing the proportion of all open contracts for Bitcoin options of DRBT by hour (see Figure 9), it is expected to close higher than USD 34,000 due to the high proportion of call option premiums around USD 34,000, the expected maturity settlement price. .

The price of Binance BTC/USDT, calculated by the institute’s quant program, for the day is $33,513 (pink line), and the current price is above this price and the price of the day and the moving average of the 20th day, so if the price continues to rise 1) Rebound after supporting the moving average on the 20th, or 2) Buy when the high price is exceeded the previous day. However, if it deviates from the 20-day moving average, it is expected to recover or wait until at least the 5th moving average is confirmed. For more detailed analysis based on market data, see ‘7. Please refer to the’Quantitative Analysis’ section.
◆Technical Analysis <Strengthening>
As of 14:00 on the 2nd, the technical analysis of the daily price movement of Bitcoin on Upbit, a domestic cryptocurrency exchange, and Binance, a foreign exchange, were found to be’neutral’ and’buy’, respectively. Looking at the detailed evaluation items, one of the oscillator indicators in Upbit was’Buy’, 4’Sell’, and 4’Neutral’ opinions and’Sell’ opinions, and the moving average indicators are 8’Buy’ and 4 It was summarized as a’buy’ opinion as a suggestion’sell’.

If you look at the detailed items of Binance, among the oscillator indicators,’Buy’ has 3,’Sell’ is 2, and’Neutral’ is 4, sending a’buy’ signal, and the moving average indicator is’Buy’ with 10, and ‘ ‘Sell’ was summarized as’active buy’ with two.

◆Quantitative analysis
◇Crypto Fear & Greed Index <Strengthening>
The’Fear and Greed Index’ provided by the cryptocurrency data provider Alternative.me was 76 points, down one point from the previous day, maintaining the extreme greed stage of the previous day. The index closer to 0 indicates extreme fear in the market, and closer to 100 indicates extreme optimism.

◇Comparison of return by asset compared to the beginning of the year (%) (as of February 2, 14:00) <Strengthening>
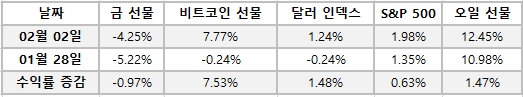
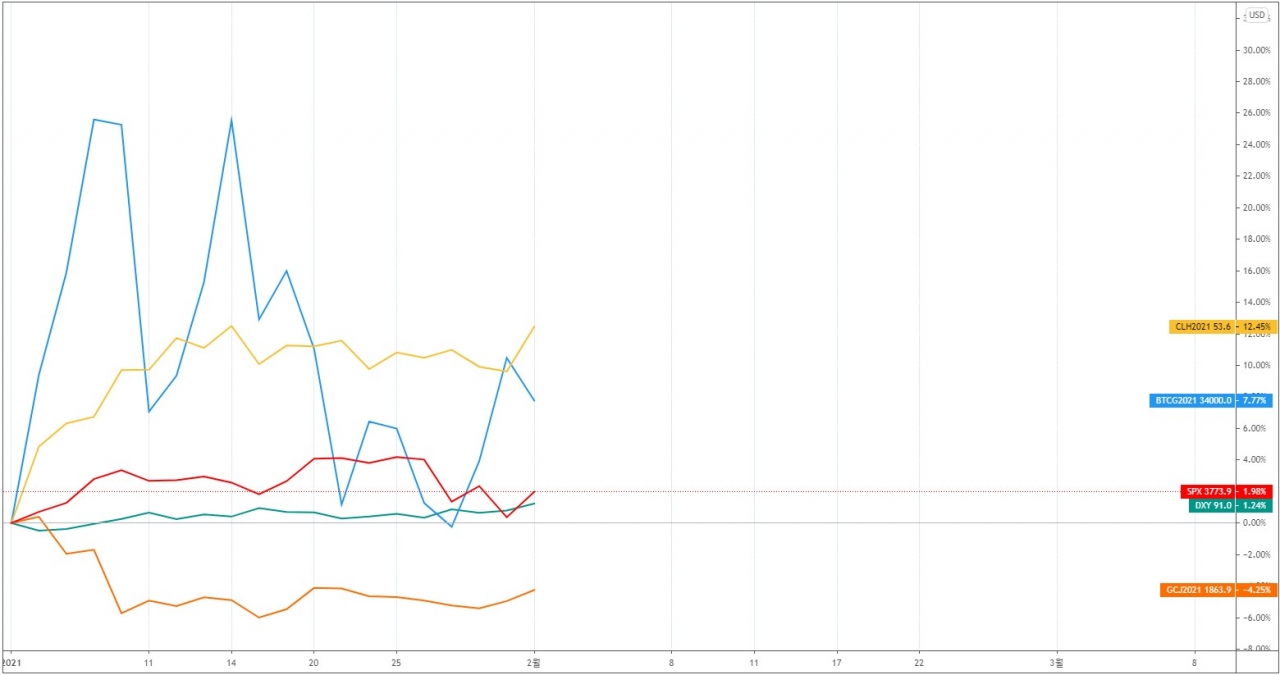
As the bitcoin price enters a rebound, the US CME Bitcoin futures’ return to the beginning of the year has turned up to 7.77%, up 7.53% from last Thursday. However, oil futures, which have been on the uptrend since the beginning of the year, climbed +1.47% to 12.45%, maintaining the lead among comparable assets. Over the same period, the dollar continued to rise, but all asset classes except gold rose overall.
The previous day, the US New York Stock Market closed higher with anticipation of an announcement of the earnings of Google and Amazon scheduled for today. The two companies increased 3.6% and 4.3%, respectively, driving the NASDAQ index. As the likelihood of a short squeeze by hedge funds due to the game stop was lowered, a sense of relief in the market began to be created, and individual investors instead turned to silver prices and the market trend was shifting. On the other hand, gold prices are showing signs of rising as silver prices rise significantly. Oil prices ended higher when OPEC’s production cuts were confirmed.
◇ Analysis of the strength of DeFi stocks <strong>
If you check the rising trend of DeFi stocks, which are spotlighted as the theme of this altcoin season, it is easy to understand whether the altcoin is strong and the progress of the altcoin season. These stocks are continuing to rise as their highest prices continue to rise.

◇Comparison of yield by cryptocurrency compared to the beginning of the year (%) (as of February 2, 14:00) <Strengthening>
As the price of cryptocurrencies including bitcoin began to rebound, the rate of return compared to the beginning of the year has also recovered. Ripple (XRP) surged and plummeted over the weekend, but it still has an upside, so its return is higher than other cryptocurrencies. As of 14:00 on the 2nd, Cardano (ADA) ranked 1st with 127.01% at the beginning of the year, and Chainlink ranked 2nd with 95.74%, and Polkadot (DOT) ranked 3rd with 94.55%. , Ethereum (ETH) ranked 4th with 88.39% and Ripple (XRP) 5th with 59.51%.

◇Bitcoin on-chain indicator analysis
① Analysis of the trend of bitcoin trading volume on the day <strong>
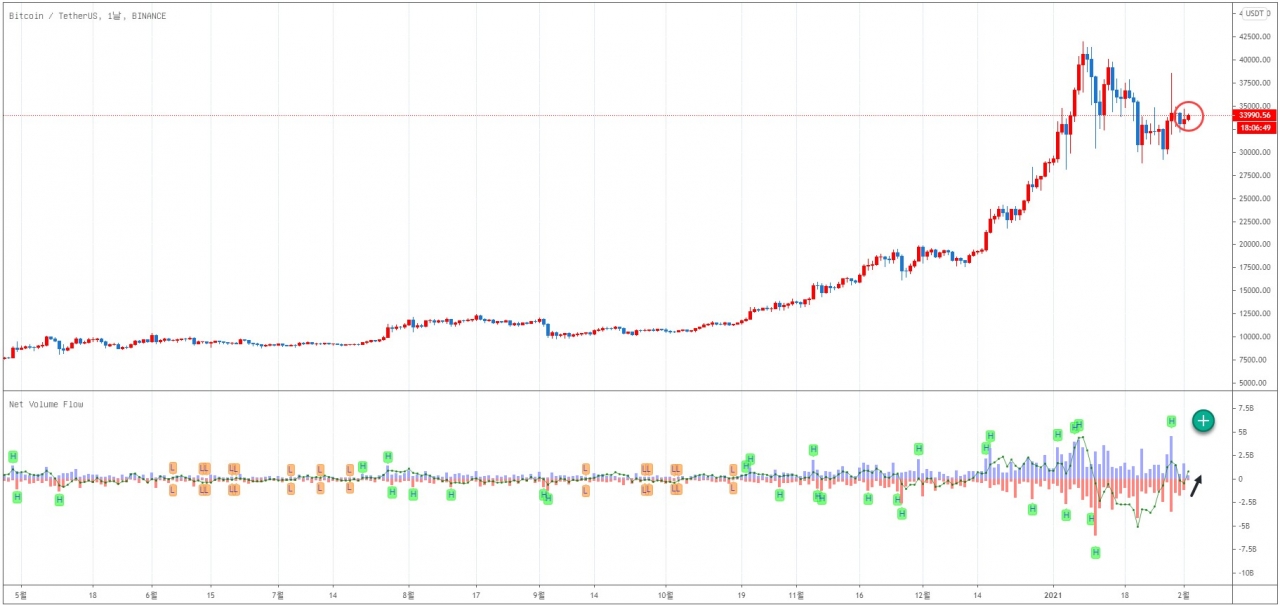
Analyzing the trading volume of BTC/USD’s on-chain data on the same day makes it easy to check the direction of the bitcoin market and respond to it. Indicator 1 in Figure 11 shows the spot trading volume of BTCUSD, BTCUSD or BTCUSDC on 10 major exchanges (Binance, Bitfinex, PoloniX, Bitex, Coinbase, Bitstamp, Kraken, HitbittyC, Gemini). Indicator 2 shows the trading volume of BTCUSD or XBTUSD indefinite futures on 7 derivatives exchanges (Binance Futures, OKX Futures, OKX Futures, Huobi Futures, FTX Futures, Kraken Futures, Delibit, BitMEX) in real time. Sum up and display.

If you look at the chart, you can see that even though the bitcoin price seems to be sideways, it is raising its low and mainly beekeeping. In addition, if you look at Index 1 in Figure 14, which shows the total amount of bitcoin spot trading occurring on major exchanges, you can see that it is increasing in a trend, thus adding confidence in the price of bitcoin. It can be seen that derivatives trading is on the decline. Looking at the indicators in Figure 15, it is also very positive that the daily price is expected to rise as rising price volatility increases, and that the bitcoin price is rising as of 14:00 on the 2nd, as the total number of purchases is greater than the total number of sales.
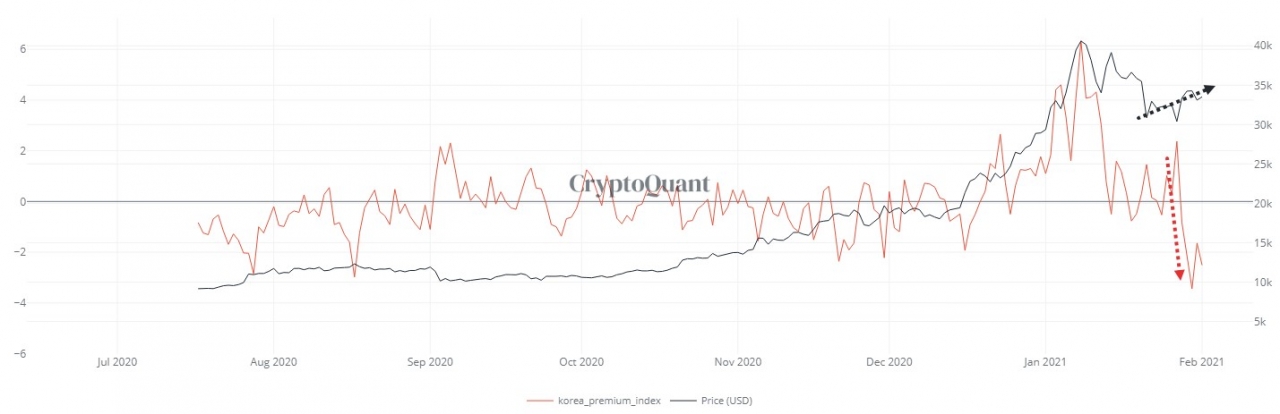
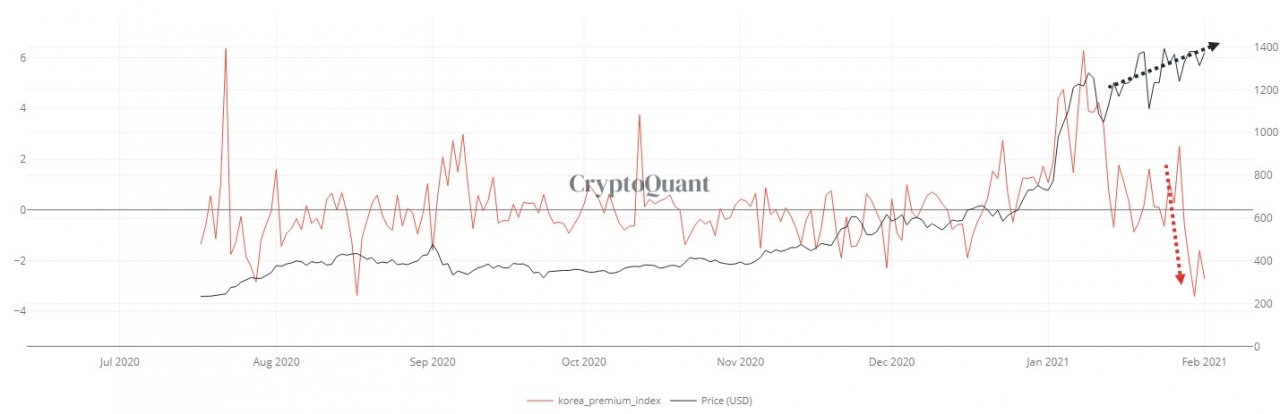
② Bitcoin price and Korea premium index trend analysis <strong>
It is interesting to compare this trend after drawing the difference between the price of bitcoin listed on the domestic and foreign exchanges (hereinafter referred to as Kimchi Premium Index) on the bitcoin price chart. In the period of price increase, the bitcoin price is higher than the kimchi premium index, and in the period of price decline, the bitcoin price is lower than the kimchi premium index, and the highest and lowest point, respectively, when the price difference widens.
As the prices of Bitcoin and Ethereum continued to rise and the Kimchi premium index for both prices fell below ‘0’, the risk factors that should be watched as a decline indicator have also been greatly reduced. If the indicator does not rise above ‘0’ again, it is not necessary to pay much attention, and mid- to long-term purchases are still valid.
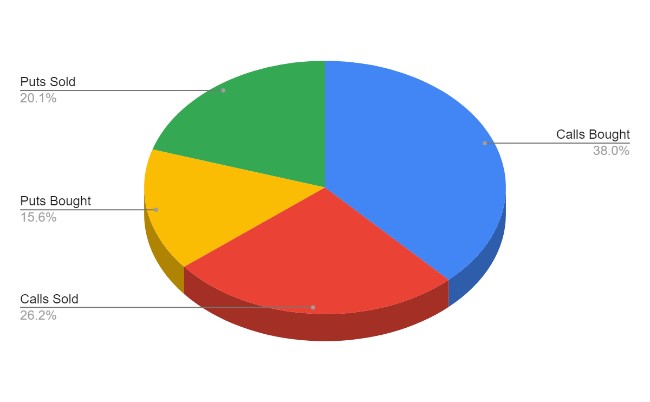
◇Analysis of the proportion of non-settled bitcoin options on the day <Neutral>
Looking at the result of analyzing the proportion of all open contracts for bitcoin options (see Figure 18) of Deribit (DBRT), which is due for maturity on two days, the increase in premium as of 14:00 corresponds to 50.31% in terms of premium and 16.32% in terms of number of contracts. In order to maintain the expected maturity settlement price of $34,000, the current upward trend is expected to continue until 5 pm, the settlement time.

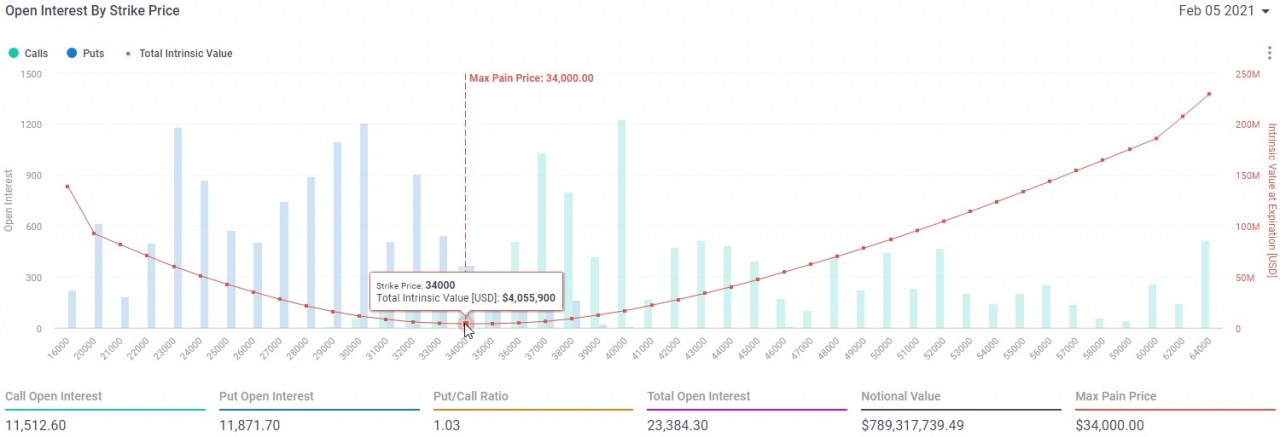
◇Bitcoin short-term price forecast based on bitcoin option data <Neutral>
It is known that in the cryptocurrency option market, the price of the underlying asset for the option’s expiration settlement tends to shift to the price that causes the most options to lose value by moving to the Max Pain Price. In other words, this price refers to the strike price with the largest number of call and put options, and the price that can incur financial losses to the largest number of option buyers at expiration.
As of 14:00 on the 2nd, the maximum paid price for option buyers for each option is expected to be $34,000 on both February 3 and 4, and the bitcoin price does not form a trend around this price and is an intraday price. The market is expected to continue expanding only volatility.

contact@blockcast.cc

![Why Chainlink [LINK] and MATIC are more similar than you think](https://i2.wp.com/ambcrypto.com/wp-content/uploads/2024/04/Chainlink_and_Polygon-1-1000x600.webp?w=218&resize=218,150&ssl=1 "Why Chainlink [LINK] and MATIC are more similar than you think")
