
![]()
The beginning of the week saw many of the market’s cryptos struggle under pressure. While most of these cryptos followed Bitcoin’s trend of falling prices, other small altcoins acted independently and registered price surges of their own.
The changing tide in the crypto-market once again highlighted the weak correlation between Bitcoin and small-cap assets since the latter marched on when BTC noted a downtrend on the charts.
XRP
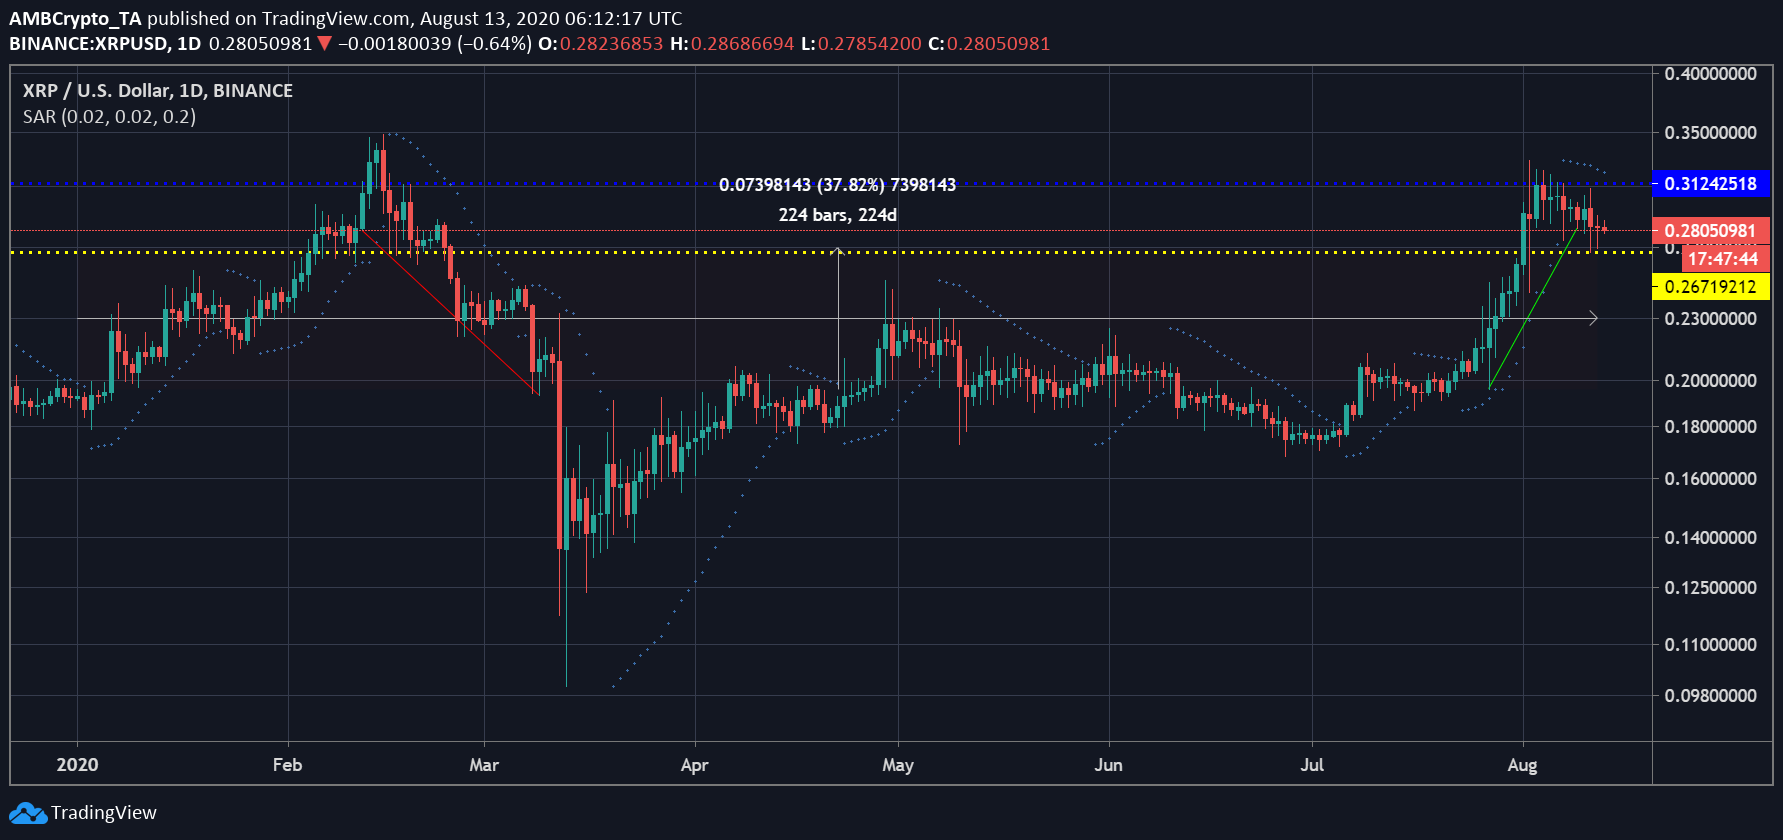
Source: XRP/USD on TradingView
XRP had been witnessing a sharp rise in its value from the last week of July until very recently. The local peak for the crypto-asset was noted at $0.3291. However, owing to the prevailing Bitcoin trend, XRP’s value had also dipped since the beginning of the week. The price of XRP, at press time, was $0.28101 as it bounced between its immediate support at $0.2671 and resistance level at $0.3124.
With the value of the altcoin sinking, the XRP market gave way to the bears, something evidenced by the Parabolic SAR. Its dotted markers were found to be above the price candles, a sign of the changing pressure in the market.
This could also be due to the minimal development taking place in the XRP ecosystem. Interestingly, as per reports, Grayscale will be introducing major cryptos like Bitcoin, Ethereum, and XRP to the masses through a planned TV campaign.
Binance coin [BNB]
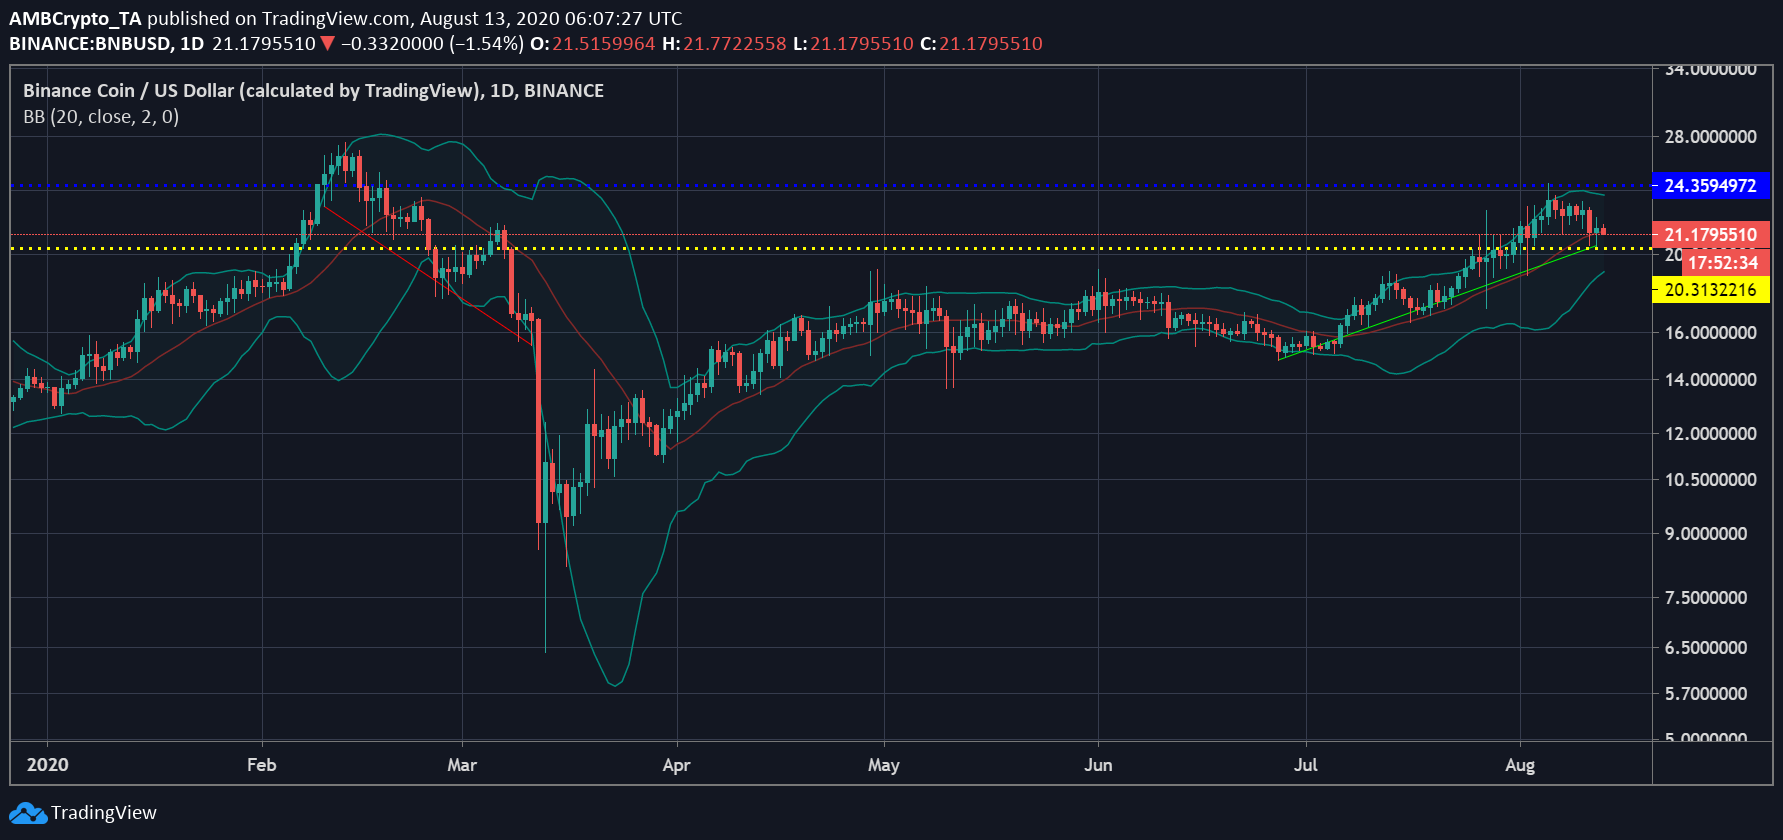
Source: BNB/USD on TradingView
Binance Coin [BNB] was recently a part of a deal wherein the DeFi service provider, Kava Labs, teamed up with the BNB investor club (BNB48Club). In terms of market performance, BNB has been following the lead of many of the market’s assets, with its value also marching higher and higher on the charts. At press time, however, the price of BNB was low at $21.30, after sinking over the past couple of days from a peak of $24.50.
According to the Bollinger Bands, the market had opened up for volatility as the bands were diverging on the charts. Similarly, the Signal line that lay under the candlesticks, was moving north, underlining a change in the price trend.
STEEM

Source: STEEM/USD on TradingView
Steem has been moving sideways since June, with spurts of growth witnessed in the market at periodic intervals. The coin has been mainly trading between $0.2361 and $0.1965, levels that have been acting as immediate resistance and support for the cryptocurrency. At press time, the STEEM market was sensing some buyers in the market, with the value of the crypto-asset placed at $0.2205. As the price moved along a straight channel, the STEEM market seemed to be losing steam, however.
According to the Awesome Oscillator, there were buyers in the market. However, they lacked the momentum to push the price of the crypto-asset further north. The indicators implied that the last time the STEEM market had high momentum was way back in early-June.


