
![]()
Bitcoin price failed to clear the $10,800 resistance and started a fresh decline against the US Dollar. BTC could continue to move down below $10,500 as long as it is below the 100 hourly SMA.
- Bitcoin failed to hold gains and started a fresh decline from the $10,800 resistance level.
- The price broke the $10,650 support and settled below the 100 hourly simple moving average.
- This week’s important ascending channel was breached with support near $10,700 on the hourly chart of the BTC/USD pair (data feed from Kraken).
- The pair is currently holding the $10,550 support, but it remains at a risk of more losses.
Bitcoin Price Resumes Decline
Bitcoin price failed to clear the key $10,800 resistance and started a fresh decline against the US Dollar. BTC traded as high as $10,803 before the bulls lost control.
As a result, there was a bearish reaction below the $10,750 and $10,700 levels. The decline gained pace after this week’s important ascending channel was breached with support near $10,700 on the hourly chart of the BTC/USD pair.
Bitcoin traded below the 50% Fib retracement level of the upward move from the $10,387 swing low to $10,803 swing high. The price is now trading well below the $10,650 support and the 100 hourly simple moving average.
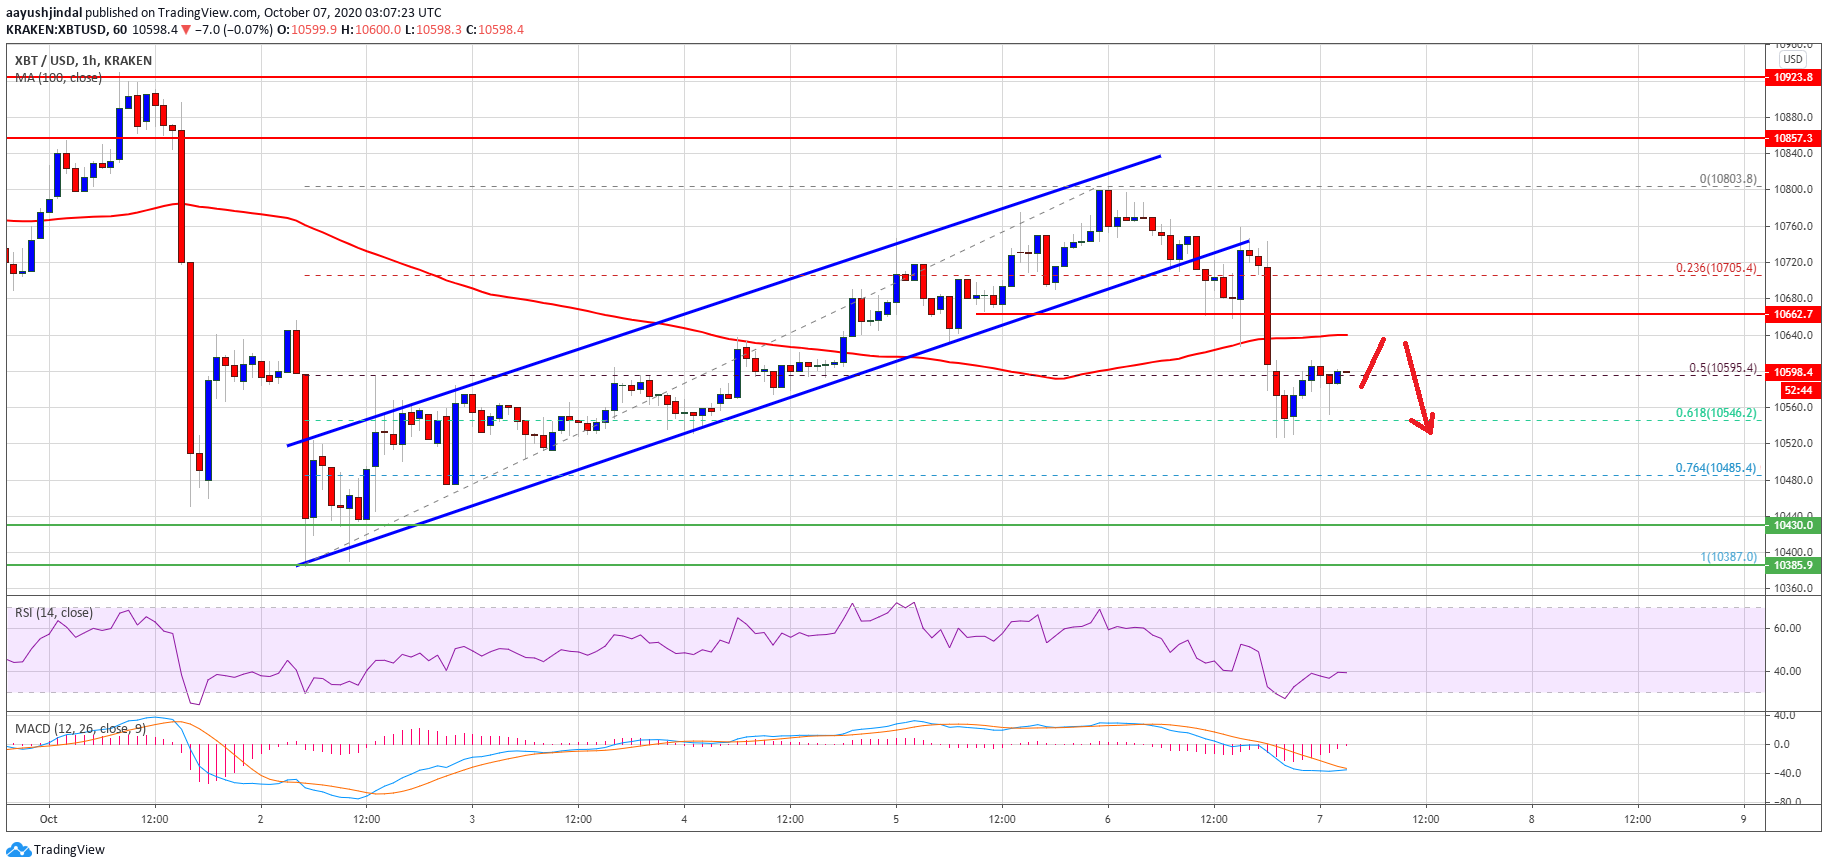
Bitcoin price dives below $10,650. Source: TradingView.com
It is currently holding the $10,550 support, but it remains at a risk of more losses. The $10,550 support is close to the 61.8% Fib retracement level of the upward move from the $10,387 swing low to $10,803 swing high.
If there is a downside break below the $10,550 support level, the bears are likely to aim a test of the $10,387 swing low. Any further losses might lead the price towards the $10,250 support or even $10,000 in the near term.
Upsides Capped in BTC?
If bitcoin starts an upside correction, it could face resistance near the $10,650 level and the 100 hourly simple moving average.
A proper close above the $10,650 and $10,680 levels might start a fresh increase. The next major resistance is near the $10,800 level, above which the bulls might aim a break above $10,950.
Technical indicators:
Hourly MACD – The MACD is slowly losing momentum in the bearish zone.
Hourly RSI (Relative Strength Index) – The RSI for BTC/USD is currently well below the 50 level.
Major Support Levels – $10,550, followed by $10,380.
Major Resistance Levels – $10,650, $10,800 and $10,950.
Image Credit: Refer to Source
Author: Refer to Source Aayush Jindal


![Want to know if Bitcoin will rise? Watch Tether’s [USDT] performance](https://i3.wp.com/engamb.b-cdn.net/wp-content/uploads/2024/04/Bitcoin-Featured-Image-1000x600.webp?w=218&resize=218,150&ssl=1 "Want to know if Bitcoin will rise? Watch Tether’s [USDT] performance")